In this day and age where we are constantly overwhelmed with content, only the content that truly stands out finds success with its audience. In this article we share 5 SaaS Tools To Create Video Infographics In Minutes.
From digital marketing to healthcare and finance, all kinds of businesses are looking for more and more creative ways to share the relevant information.
Video Infographics have emerged as one of the most entertaining and engaging tools to tell a story.
If you are looking to incentivize your content with appealing video infographics, here is a list of tools to help you create them in just minutes.
Table of Contents
5 SaaS Tools to Create Video Infographics in Minutes
There are a lot of reasons why content creators are increasingly integrating visual aspects in their content — whether it is pictures, graphs, GIFs, videos, or infographics.
65% of people are visual learners and are likely to respond well to visual information. Content with visuals instantly grabs your attention.
A video infographic is a short animated video that depicts data. Think of it as an infographic in motion that allows the audience to process the information better. As attractive as they are, one does wonder about the level of skill needed to create a video infographic.
Surprisingly, you don’t need to be a pro creative designer to make one. There are many SaaS tools available that can create a professional-looking infographic in minutes.
Here are the top five tools to help you get started with your visual storytelling today.
1. Piktochart
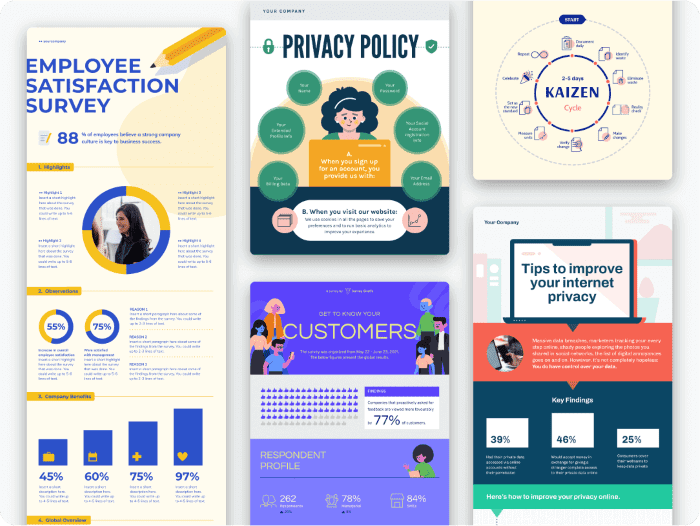
Used by the biggest brands all around the world, PIktochart is your best bet to create stellar infographics in no time. With a wide variety of templates to pick from, there is no idea or style that you cannot execute to perfection.
One of the most notable features offered by Piktochart comes with informative tutorials. You can learn to make graphics with easy step-by-step guides in no time. It offers tutorials for just about everything.
Piktochart gives you the ease to create visual content in any format — ranging from infographics, video infographics, reports, presentations, flyers, and posters. You can also liven up your social media with it.
You can either create a graphic from scratch or simply pick a pre-existing template that may suit your style. Make them as informal or as professional as you like.
No need to look around for images, illustrations, and icons to go with your infographic as well. Piktochart’s own free library of graphics and design components will be helpful in giving you the visual inspiration you need.
This SaaS tool is available for free, though you get some great additional benefits with paid plans. It’s easy to use and does not require you to have any graphic design skills at all.
There is a free plan available. The paid plans are available at $24.17/month for the Pro version and $12.50/month for the Lite version.
2. Canva
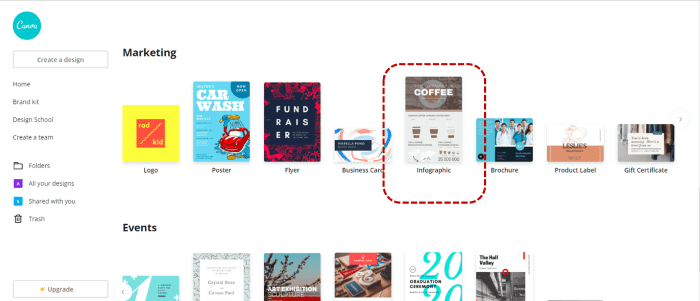
Canva is a design tool that lets you create infographics as well. It is not primarily meant for infographics, it is meant to be for design overall. That doesn’t mean you cannot create amazing infographics in minutes.
The most lucrative feature that comes with Canva is the range. You get a wide variety of templates to choose from and most of them will be available on the free plan.
Canva’s free plan can also be coupled with a few paid elements to create a Freemium plan. This saves you the trouble of subscribing to a paid plan. You can simply pay for the element you want to use.
You also don’t need to have a lot of design knowledge to operate Canva. It comes with tutorials and guides for making every kind of graphic.
Another useful feature Canva offers is the option to collaborate with others. Real-time collaboration helps you team up with colleagues or friends in other departments or places. You can invite other people to edit with you or leave feedback.
This makes it an excellent tool for office use. All the information, pictures, and logos can be stored and accessed in the same place, enabling smooth collaboration between teams.
Canva’s packages are specialized in the nature of operations. You have packages for teachers and students, packages for enterprises, and for non-profit organizations as well. The last option is meant to be free for eligible non-profits.
You can avail the free version. The paid plans are available at $12.95 for work. The freemium plan lets you buy custom elements on the free plan.
3. BeFunky
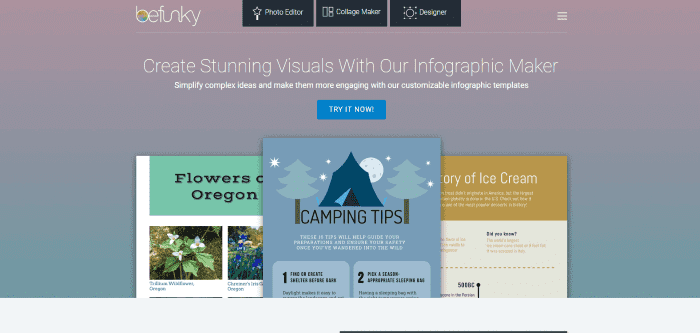
BeFunky is primarily a photo editor. The infographic maker tool comes with its own design package. Thus, its user interface is the same as the rest of the tool i.e., drag and drop. It lets non-designers create stunning graphics with ease.
The free plan may be a bit limiting to users with heavy usage, as it has only one template. The paid plan offers much more variety. One of the most impressive things about BeFunky is its simplified approach that reflects in its plans as well.
There are no multiple plans that users may find confusing. There is only a single affordable plan that unlocks a world of features for a simple fee. The tool also has an in-built library of Pixabay and Unspalsh that, in its own words, offers “over a million free stock images”.
Other unique features include an impressive range of vector images, so you will never have to scout for icons to go with your content. You can also remove the background of the images to be used in portraits or product images.
There is an option to retouch the photos right there to make them match the content. You can also crop and resize them in the tool itself. So you won’t have to edit them outside of the tool.
Turning photos into art to give them a unique look or batch-editing a bunch of photos together, BeFunky gives you the option to go as deep or as light as you want with photo editing.
There is a free version available and the paid plan starts from $6.99 per month.
4. Infogram
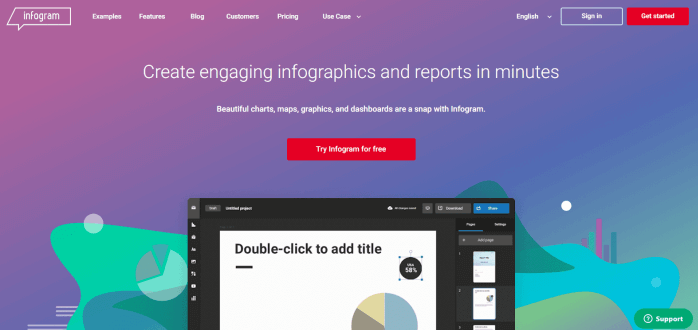
As the name suggests, this SaaS tool is perfect for official use. It’s an infographic maker that aims to make complex data and numbers-heavy information engaging for the audiences.
You don’t have to stare at a blank screen and start from scratch. Infographic’s designer templates let you create catchy graphics with customizable options. So, you will always have a base to begin with.
In fact, you can also get a custom template for your own brand, complete with your logo, fonts, and colours. Additionally, you can collaborate with your team to create and edit infographics in real-time. Moving graphs that come with video infographics adds another layer of depth to your presentations.
Though the best feature that comes with Infogram is the data analytics incorporated into the paid plans. You can get engagement analytics, such as how many people shared your work, average onscreen rate, viewer demographics, and much more. You get even the tiniest details, like how many people hovered over the toolkit option.
Nearly no other competitor offers this in-depth insight. Create custom links to track what part of your content your audience engages with the most.
The only limitation this tool suffers from is the lack of variety. You have limited options for the free plan and not much opens up with the paid plans either. The price may also be a bit on the expensive side for some users.
There is a free plan available and the paid plans are available at $25/month for the Pro version and $79/month for the Business version.
5. Snappa
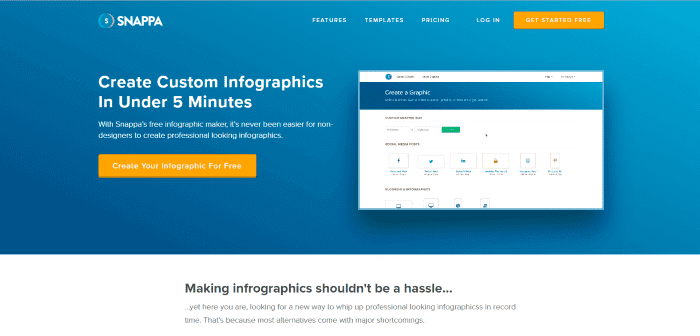
This particular tool is a paradise for free users. It’s quick, easy to use, and very feature-rich. Many tools hide their features behind a paywall. With Snappa, you get access to almost all the features from the paid plans. Many users with low usage don’t feel the need to subscribe to a paid plan.
The only limitation is the number of downloads allowed per month. The paid plan, however, is quite affordable for the average user. Add to that, the user interface is so easy that you don’t even have to watch a beginner’s tutorial to get started. You can simply get started.
The image dimensions are already presently optimized for social media platforms like Facebook, Instagram, and Twitter as well as emails and blogs. It boasts of more than 5,000,000 images in its library — all royalty-free and licensed for commercial use.
Moreover, you can edit the pictures on the go, delete their backgrounds, and resize them easily. You can add animations to the video infographics as well. Adding such additional features makes the content stand out and makes it look professional.
Another interesting feature that makes Snappa so efficient is the feature to schedule posts. Put simply, you don’t have to leave Snappa to share your infographics on social media platforms with this feature.
A free plan is available and the paid plan is available at $15/month for one user.
Conclusion
There you have it. These tools will help you create stunning infographics in minutes. You don’t need to have graphic design skills to make one. The templates and easy editing options for these tools will take care of everything.
You can now focus your attention on letting your creativity shine and giving wings to your ideas. Your infographic software will take care of the rest.
Join The Logo Community
We hope you have enjoyed What Are the Different Types of Business Signage?. If you would like more personal tips, advice, insights, and access to our community threads and other goodies, join me in our community. You can comment directly on posts and have a discussion.
*TIP – We use and recommend DesignCuts for all your fonts, mockups and design bundles.
 Author bio
Atreyee Chowdhury works full-time as a Content Manager with a Fortune 1 retail giant. She is passionate about writing and has helped many businesses achieve their content marketing goals with her compelling content. She loves to read, travel, and experiment with different cuisines in her free time.

